Physical Address
304 North Cardinal St.
Dorchester Center, MA 02124
Physical Address
304 North Cardinal St.
Dorchester Center, MA 02124
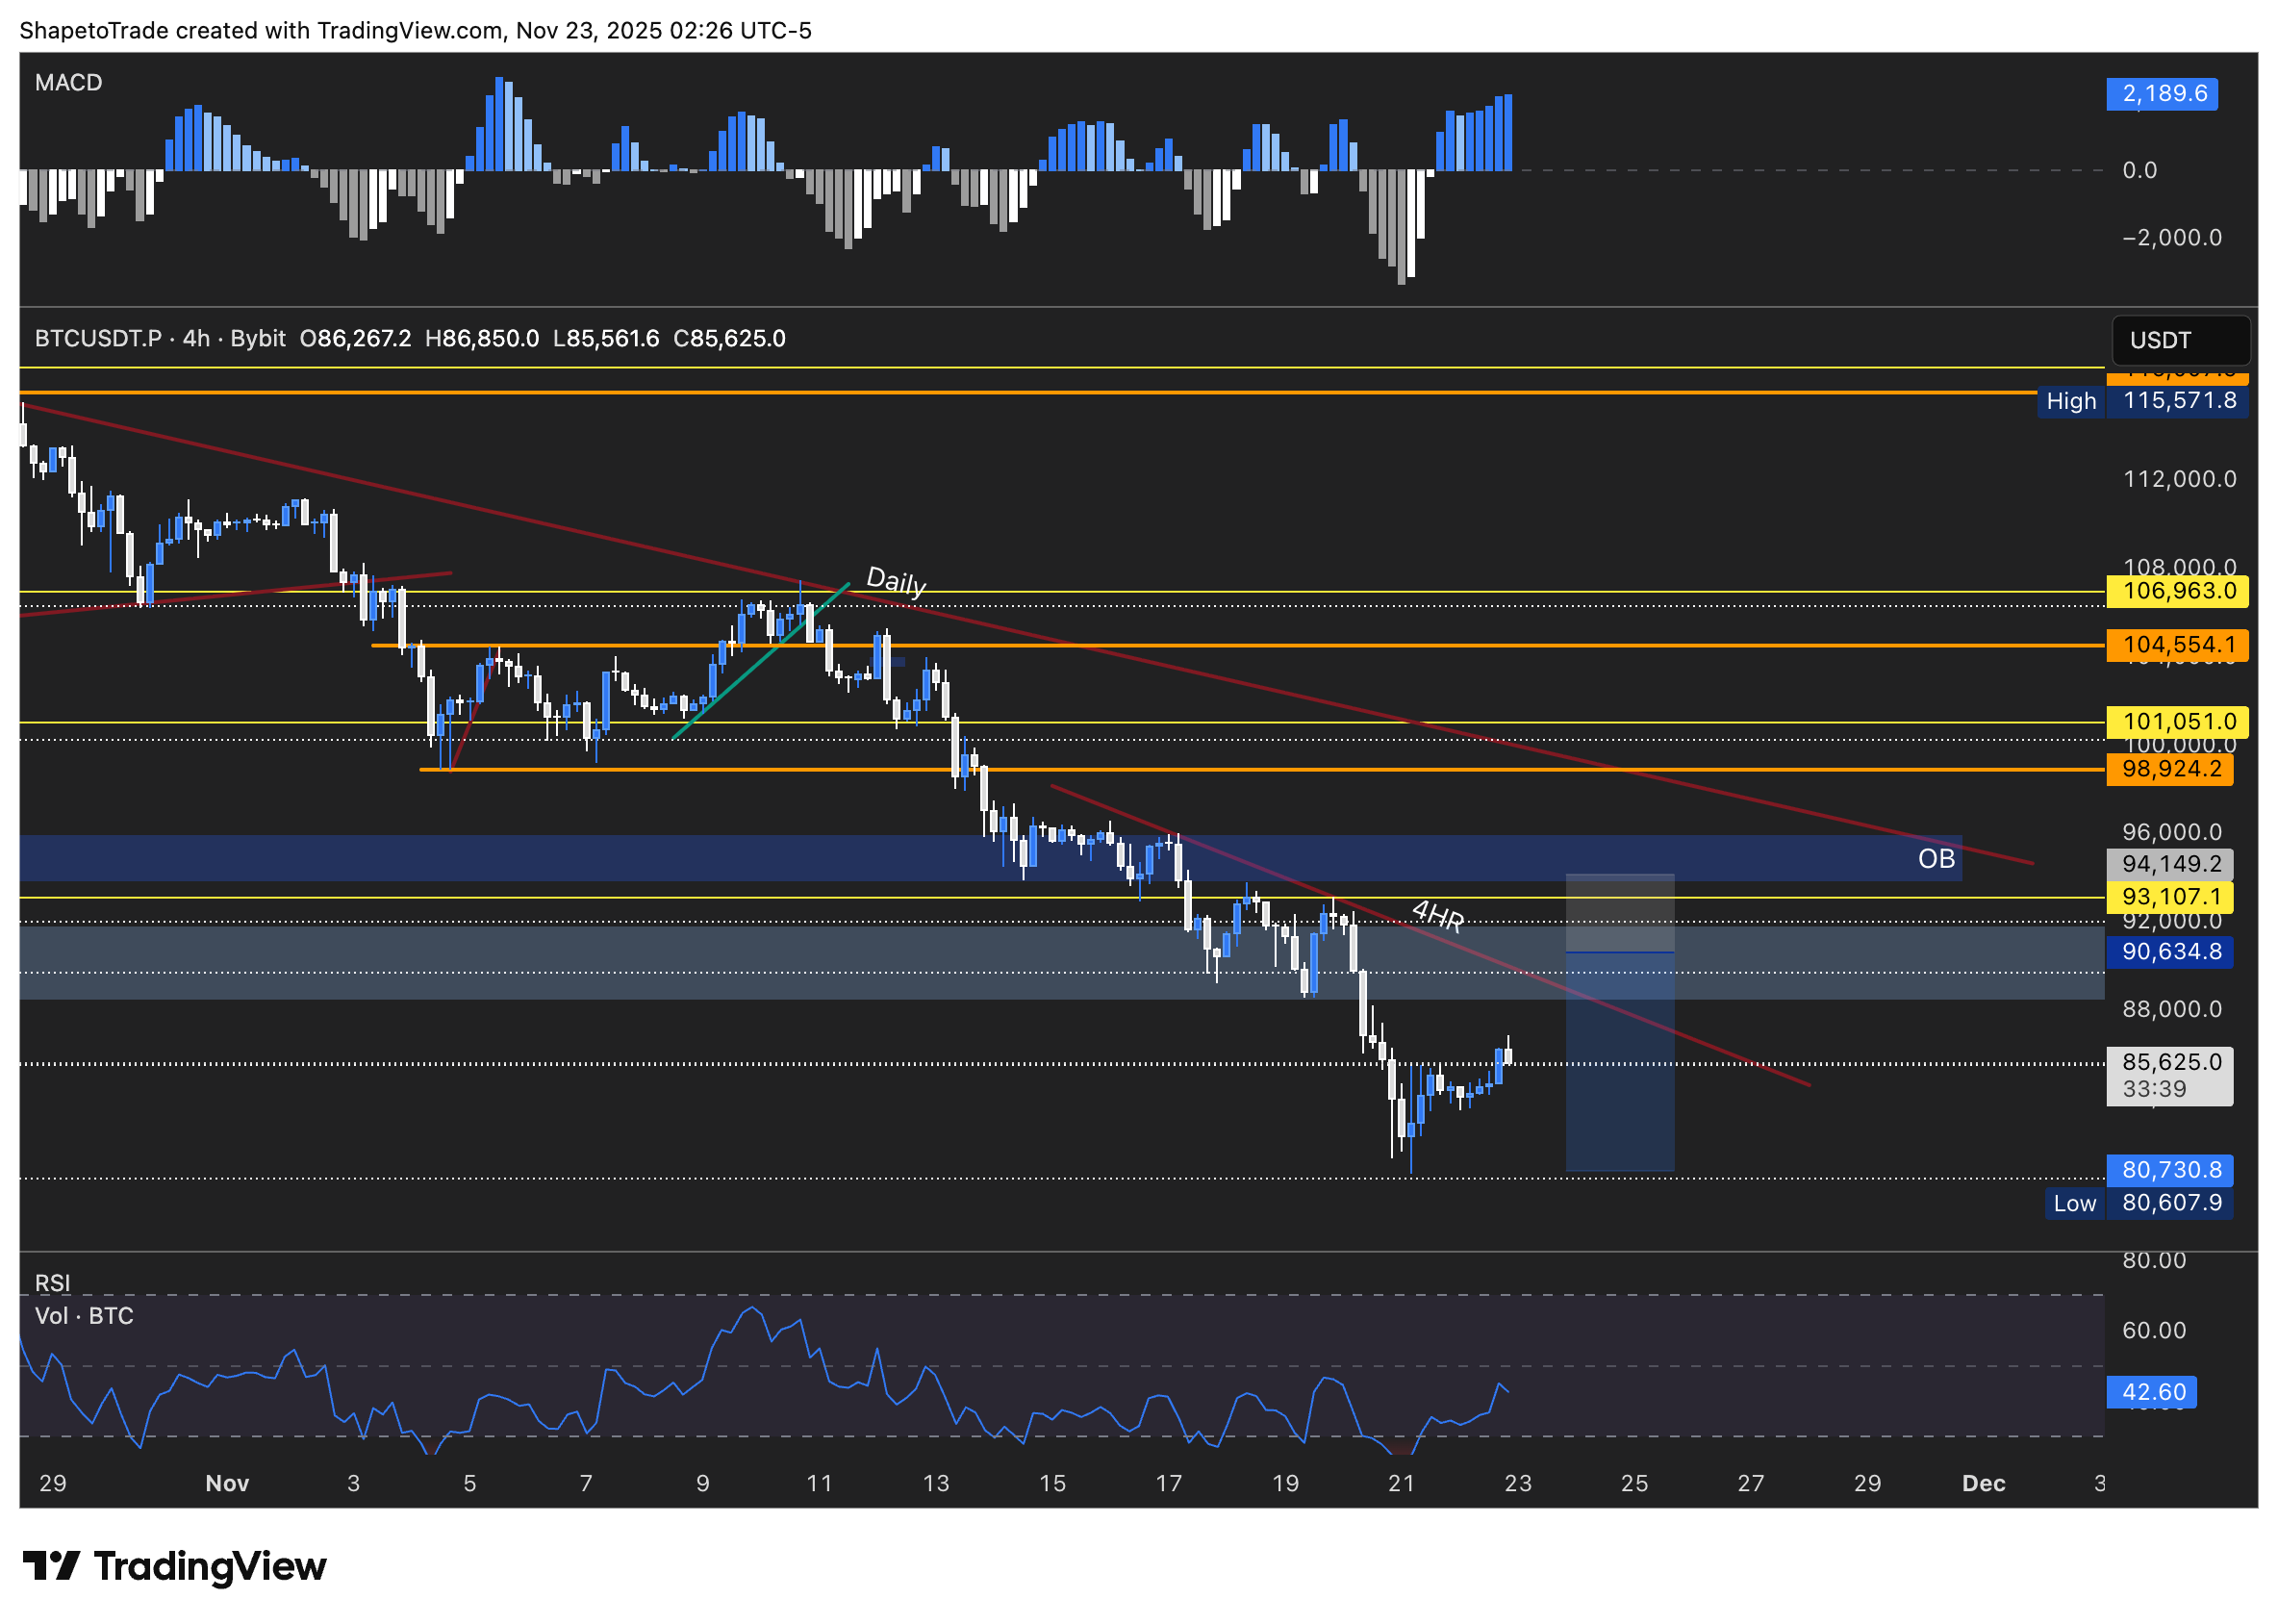
BTC rebounds off support, but major resistance still defines the trend.
This bitcoin price analysis looks at Bitcoin’s latest bounce from the mid-$85,000 region while the higher-timeframe trend continues to point downward. Despite a short burst of buying pressure, BTC remains capped beneath both the daily and 4H descending trendlines—two levels that have defined the market’s direction for weeks. The recent upward move is encouraging but still resembles a relief rally rather than a confident trend reversal.
Bitcoin’s reaction from support shows buyers stepping in, but the broader picture hasn’t shifted. Until BTC breaks through major resistance and holds above it, the downtrend remains firmly intact. Momentum is improving on lower timeframes, yet the structure continues to favor sellers on the bigger picture.
The most important area now sits between $92,000 and $96,000, where several major resistance factors converge:
For this bitcoin price analysis, this range is the “decision point” for BTC. Without a clean daily close above it, the bearish trend remains dominant.
Market indicators reinforce the mixed narrative:
These signals reflect a market that is stabilizing, not reversing.
If BTC gets rejected at $92K–$96K, downside targets include:
This fits the current trend and market behavior.
A convincing breakout needs:
Only then does a true trend reversal begin to form.
Buyers have room to push higher, but they’re still fighting the dominant trend. Until Bitcoin breaks above the $92K–$96K block and holds it, any bounce remains short-term in nature. Relief rallies can be strong, but they don’t change the overall picture—the downtrend still has control unless proven otherwise.